Your paid campaigns analyzed in a new light
Replai analyzes paid campaigns’ data from the ad creative point of view, to identify what’s working, when and where.
Request a DemoThe new performance dashboard loved by UA and creative teams
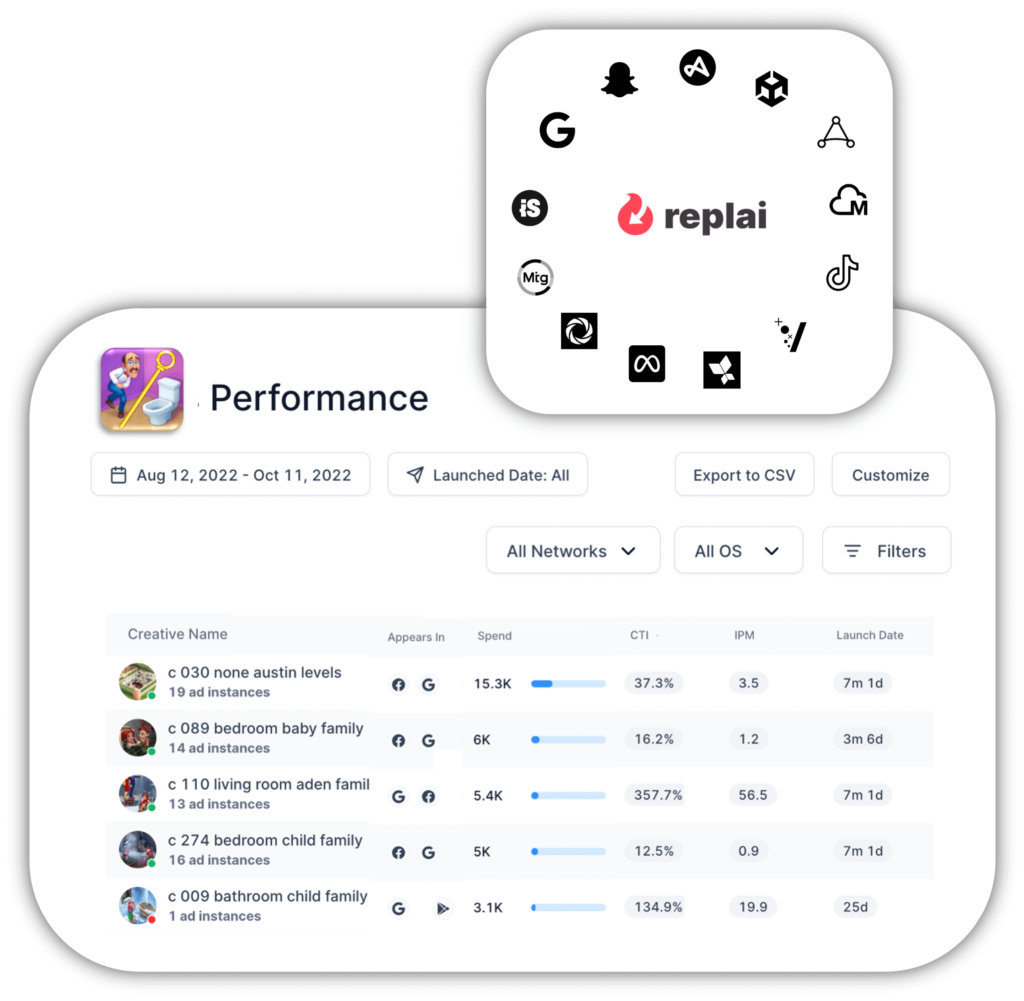
Ad performance data from ad networks is siloed by campaigns and ad groups. UA and creatives teams are wasting time jumping across platforms and tabs when analyzing creative performance.
With Replai, your ad performance data is centralized and re-organized from a creative viewpoint. Our easy-to-use, customizable dashboard adds new dimensions to your paid campaigns analysis.
Saving time while learning new insights
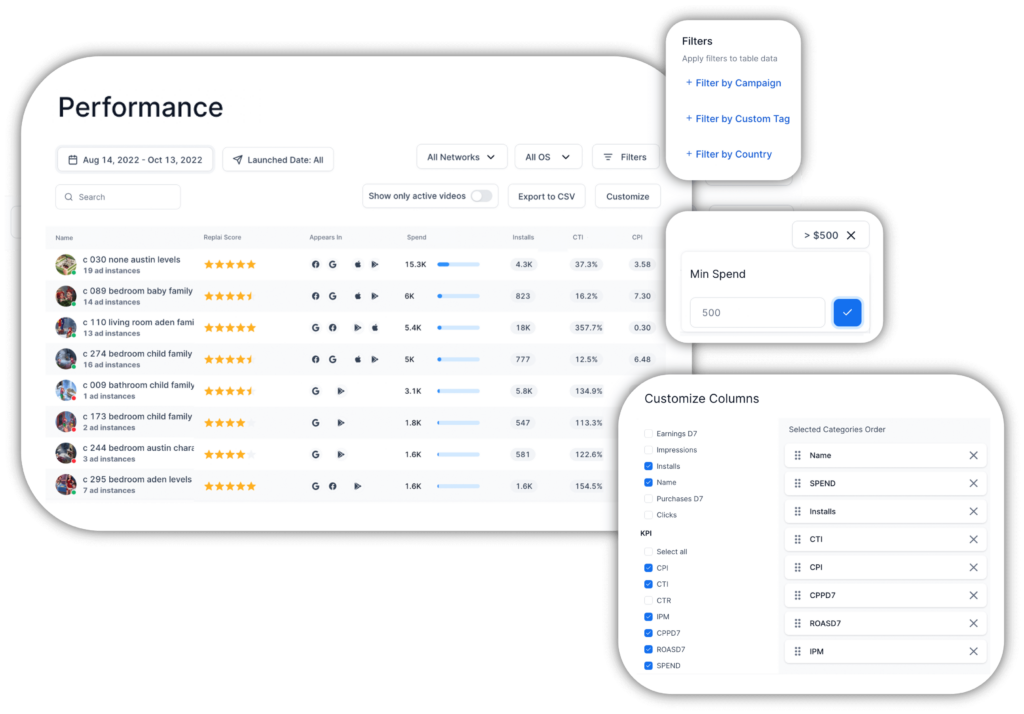
One dashboard, multiple functions
All your video creative performance data is available on a single, flexible dashboard.
Use filters such as ad networks, campaigns, countries, spend, date range, creative launch date and even custom tags.
Select and analyze your favorite metrics such as Installs, CTR, or ROASD7, to draw key learnings about your campaigns’ results.
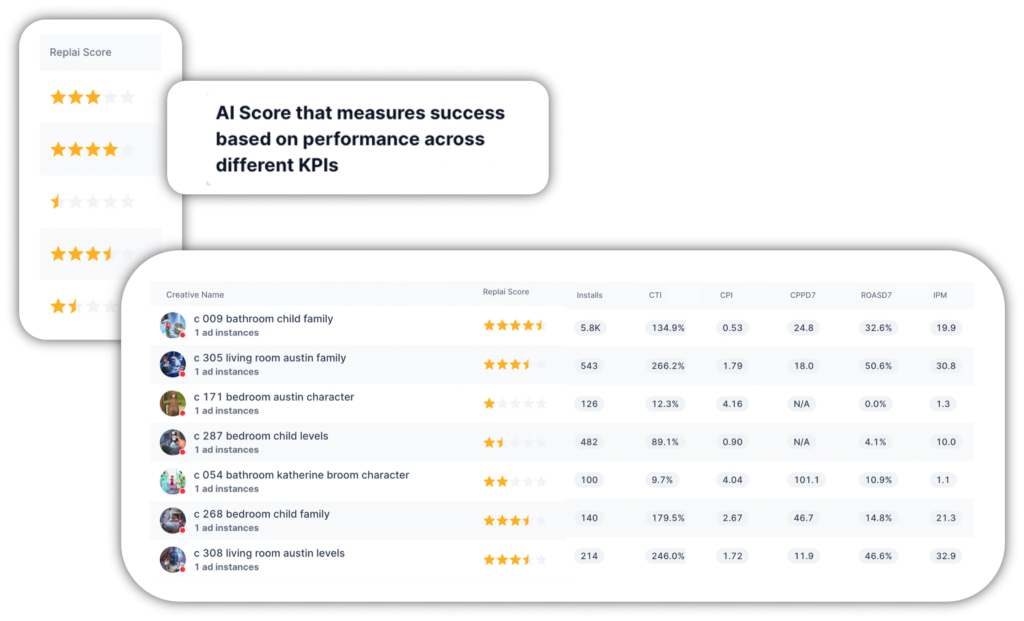
Predict success with our AI-driven Replai score
When teams have too many metrics and KPIs at hand, numbers can create clutter and lead to confusing analysis.
To solve this problem, we built Replai score, an AI-driven algorithm that blends all your team’s core metrics, such as CPI or IPM. With Replai, you can easily spot the top performing creatives and the less performing ones at a single glance.
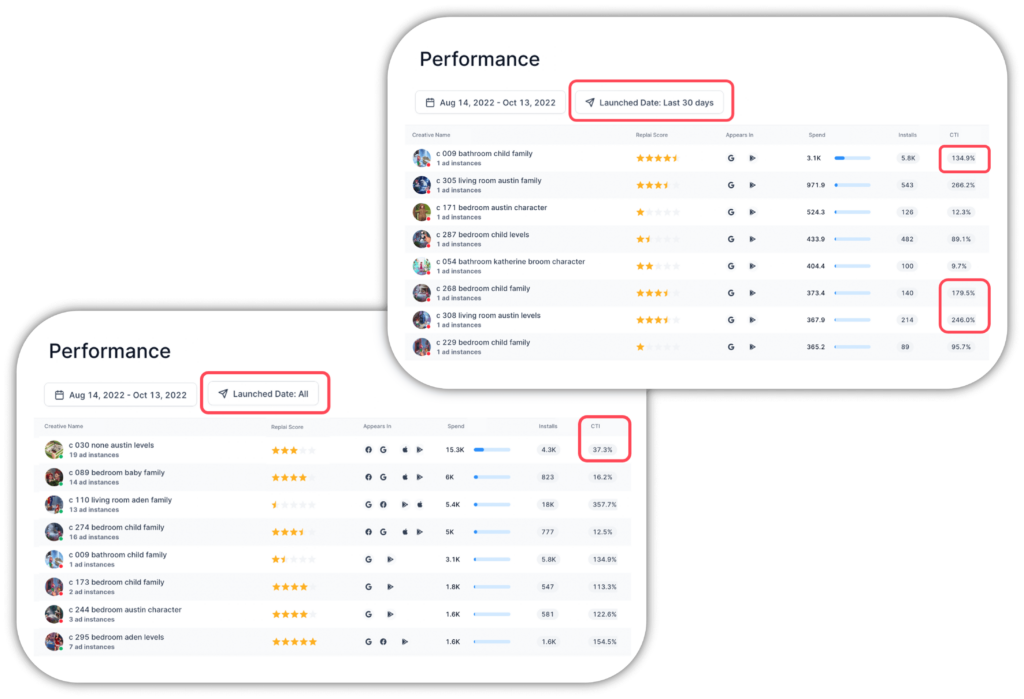
Compare your latest and oldest creatives
If you rely on older winning creatives, you are at risk of creative burnout. Replai gives you the possibility to filter performance data by creative launch date – and identify your latest winning creatives that will pertain the on-going success of your user acquisition strategy.
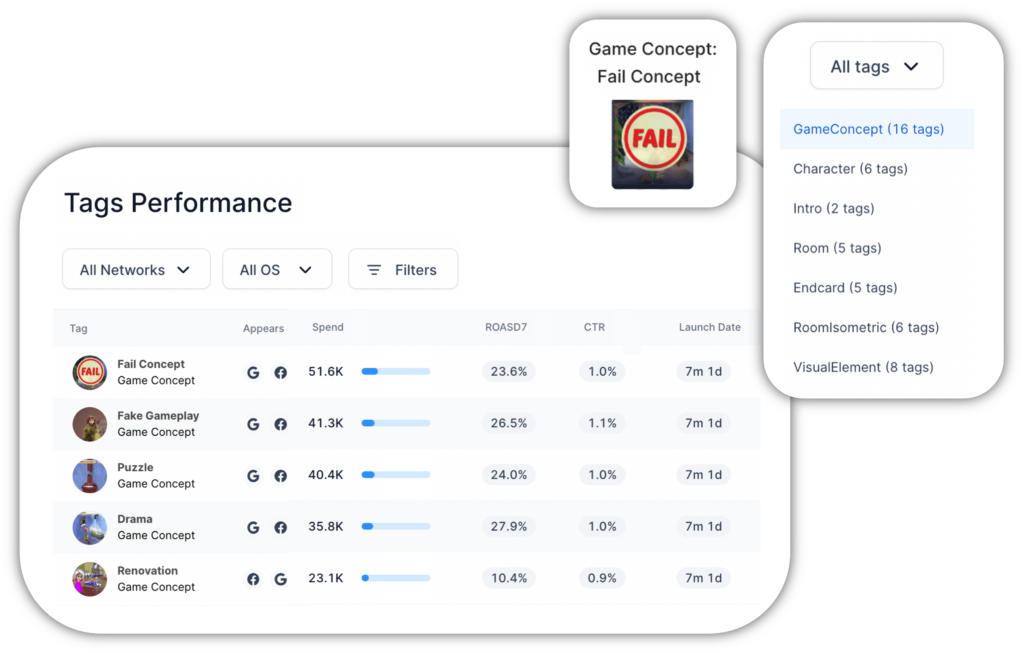
Performance data broken down to the video element (tag)
Tap into a new dataset that matches video elements (tags) with their creatives’ paid campaign performances.
Filter, group and analyze all your video elements used across your creatives under the lights of your favorite UA KPIs.
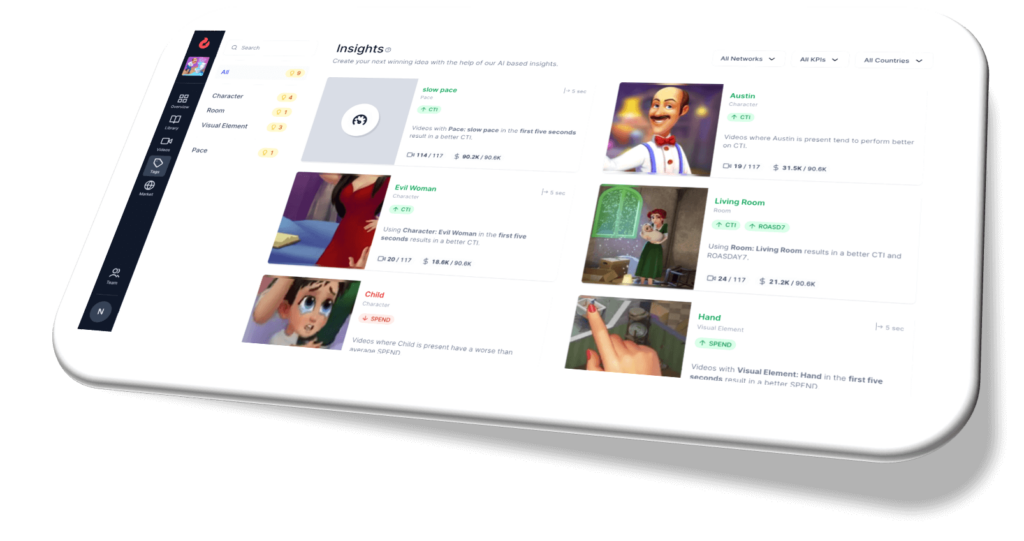
The platform suggesting your next moves
Replai provides actionable insights that help teams identify what they should do next. Don’t know how to further optimize your paid UA campaigns? Replai’s data will highlight potential improvement paths.
Observation: The most successful creative created in the last 90 days is only promoted on Google ads, for Google Play.
Next Step: Expand the use of this creative to other ad networks and OS platforms.

Observation: Videos featuring the “Child” character have the best CTI rate (click to install), but most of the spend was on videos featuring the character “Katherine Broom”, who has the lowest CTI rate.
Next Step: Push more spend and promote more videos featuring the character “Child” instead of “Katherine Broom”.

What are the benefits of Replai’s performance dashboards?
- Save time when analyzing the performance of your creatives and campaigns
- Quickly identify what creatives and tags work well
- Discover new insights by leveraging exclusive datasets
- Improve your paid UA campaigns with data-informed next steps
- Build up knowledge on paid UA best practices
")
Jatin Mittal
UA and Monetization Manager at TapNation
As the campaign manager pre- and post-Replai I could immediately tell the difference. Before I was wasting time jumping between platforms. With Replai I could simply filter by country and identify cross-platform performance in one place. There is no debating the amount of time we have saved with Replai.
Learn more about our product features


Frequently Asked Questions
Ad fatigue happens when your target audience is seeing the same creative too many times. As a result, your audience is less likely to engage with your ad, resulting in dwindling marketing performance results. Ad fatigue drives KPI trends down and is a factor of concern for performance marketing managers.
You can find out if your creative suffers are burning out based on the trends of your performance metrics (such as CPI or IPM), on a day-over-day, week-over-week or month-over-month basis. If the evolution of your KPIs for a specific creative or campaigns are trending downward, while you didn’t make any major change in your campaigns’ settings, you’re likely to suffer from ad fatigue. The remedy is to update and refresh your creatives.
We cover all major UA metrics shared by ad networks and mobile measurement partners.
These includes: Impressions, clicks, Installs, Earnings D7, Purchases D7, CPI, CTI, CTR, IPM, CPPD7, ROASD7, Spend. We can also build custom metric integration for a fee.
Yes, Replai has built-in export functionality so you can export any performance data from Replai as a CSV.
Simply filter your creative performance data, customize your dashboard by selecting the columns you’d like to see, and download the chart as CSV to share with your peers.
Yes. App publishers often feature the same creatives across different ad groups, ad campaigns and ad networks.
Replai aggregates data on the creative level, so you can see the following for each creative:
– which OS the creative was promoted for (Google Play, iOS)
– which ad network(s) the creative was promoted in (Facebook, Snapchat, etc.)
– how many ad instances the creative was used in (ad groups, ad campaigns)
This helps better understand which creatives are being heavily used, versus those that are restricted to a certain ad group or ad network.