Track your competitors’ creatives to a brand new extent
Tap into Replai’s competitive ad library, with ad creatives deconstructed down to each video element.
Request a DemoEnhance your creative process with actionable competitive data
Benchmarking competitors’ creatives is a long and tedious work, yet it can lead to new successful ideas and campaigns.
With Replai’s creative market insights, you automatically track the mobile market’s creatives landscape as it evolves. Deconstruct your competitors’ ads, and compare what video tags they use more – or less – than you.
Please note: this feature is currently in Beta.

Spark new ideas by analyzing your competitors’ ads
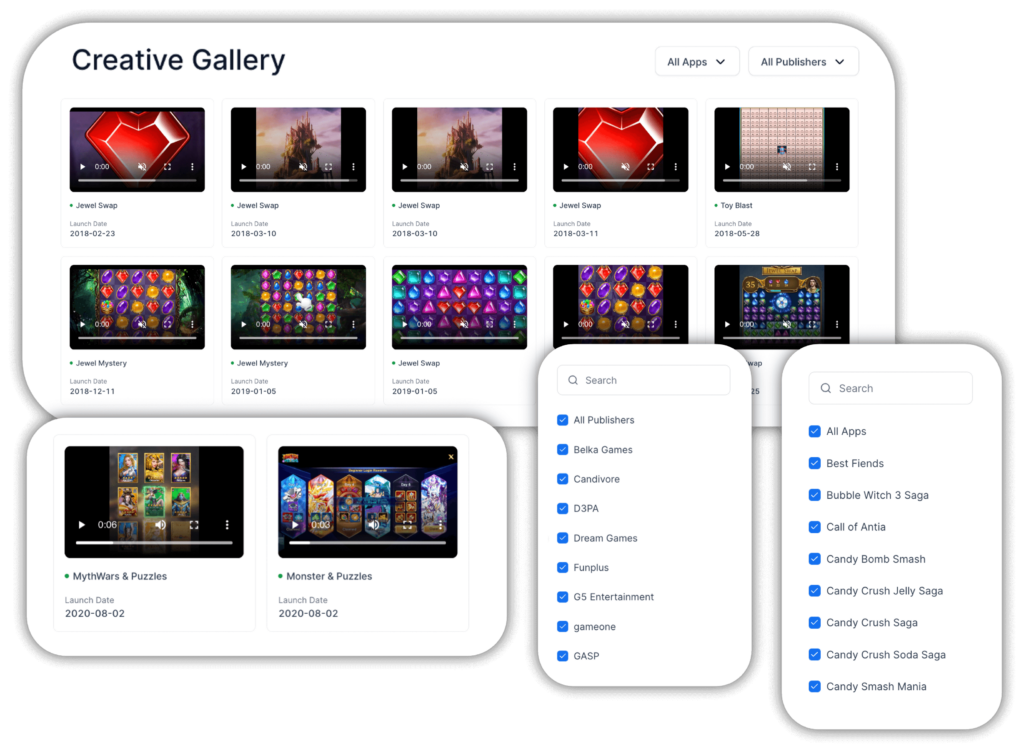
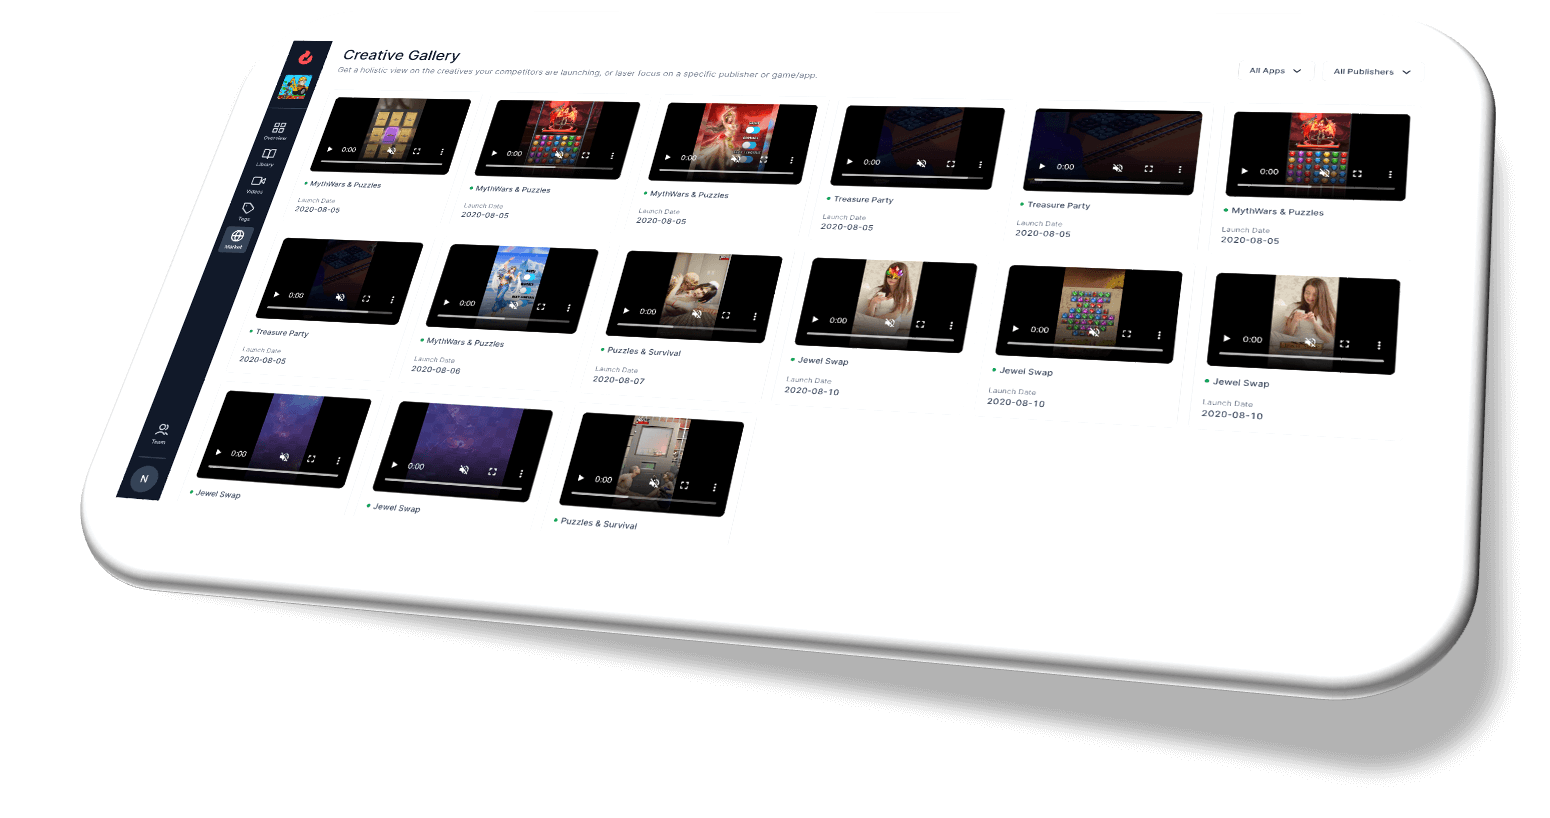
Browse the mobile ad creative market
Check your competitors’ videos and strategies in Replai’s creative gallery. Sort and filter by app and app publishers, view their launch date and quickly play videos side to side.
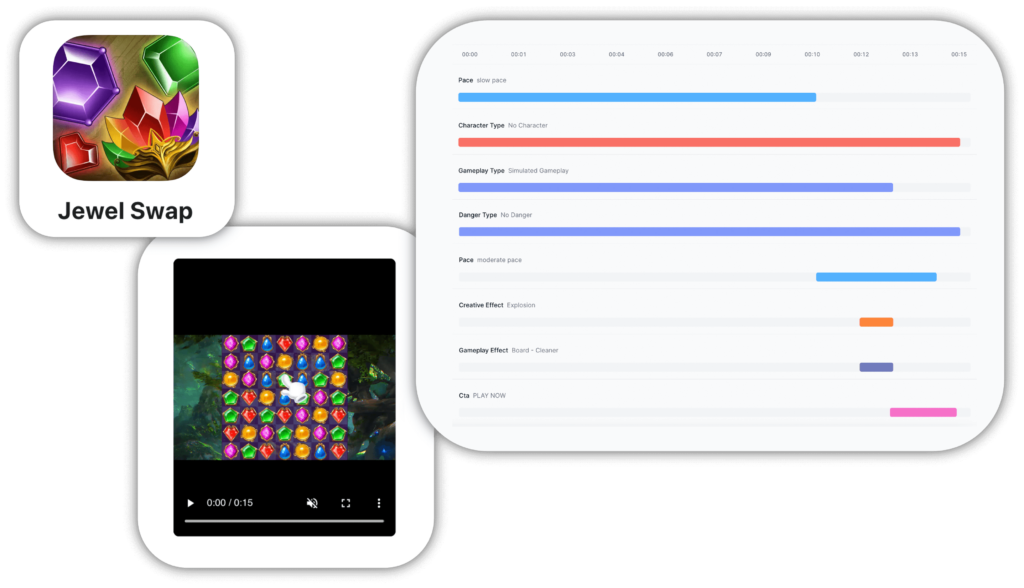
Deconstruct your competitors’ videos
Just like for your own videos, automatically deconstruct your competitors’ video assets on a timeline view, where you can see each video element (tag) unfolding on an interactive timeline.
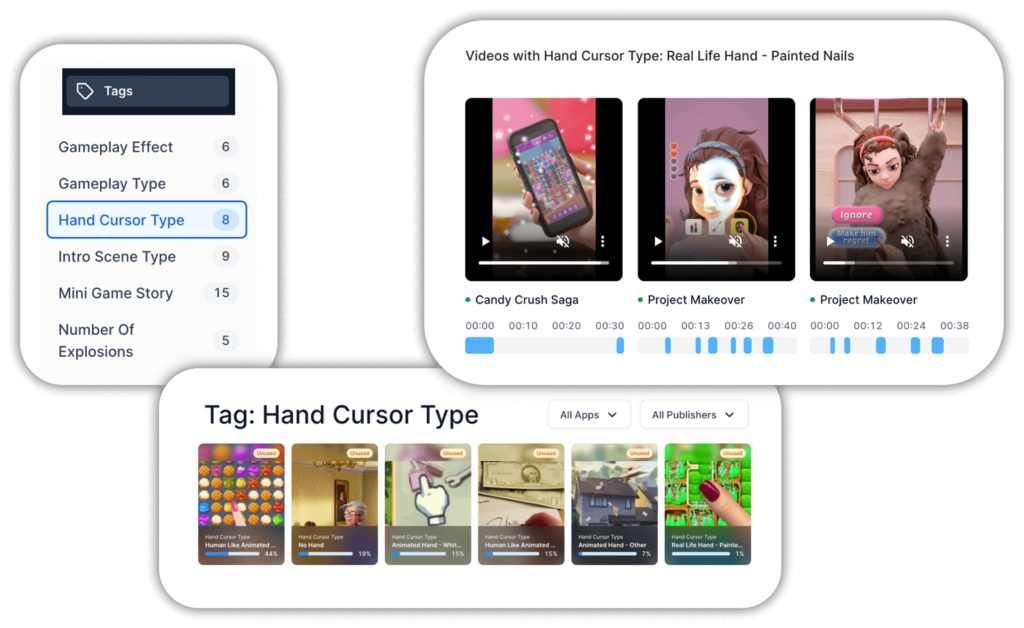
Your competitors’ video elements tagged and ready for analysis
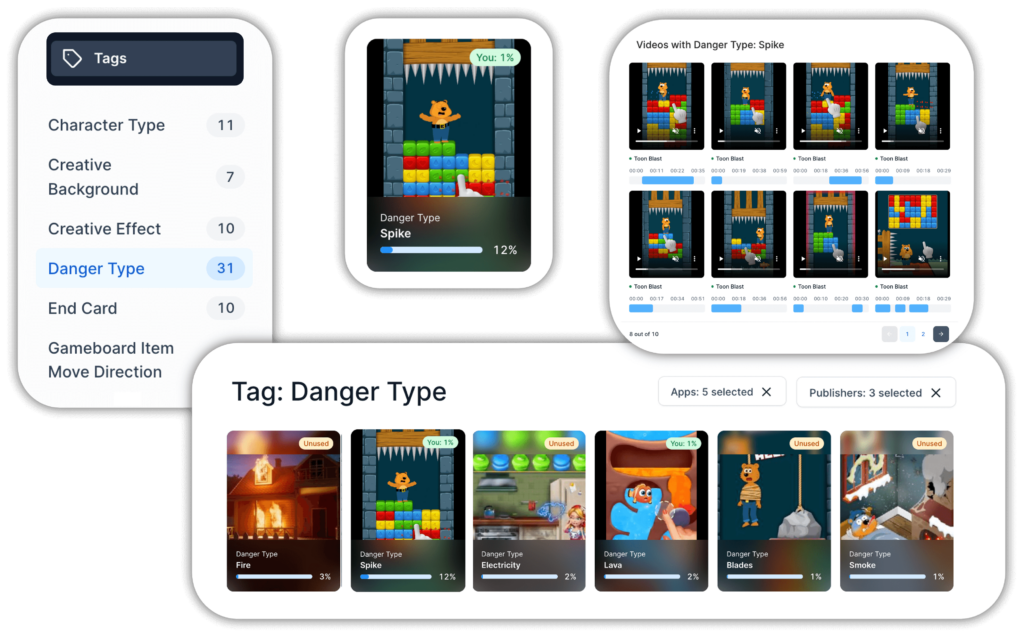
With Replai’s tag gallery, you can visually explore how your competitors are featuring various video elements in their creatives. Save time by analyzing video elements (tags) such as intro scene type, hand cursor type, gameplay type, and many more.
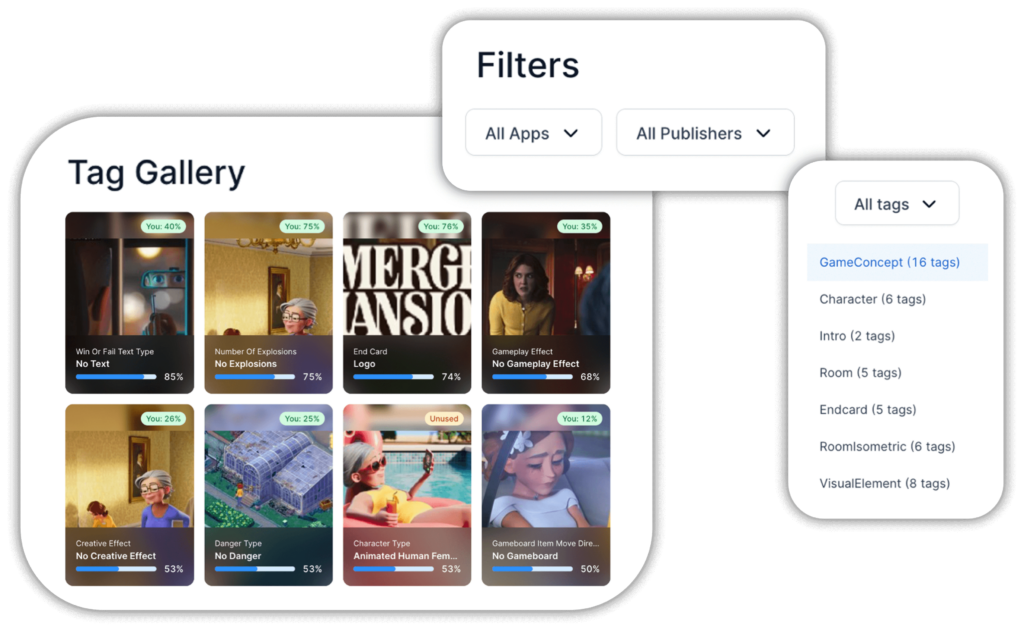
Compare yourself to the market
See how much a specific video element (tag) is being used in your market, in comparison to your own creatives. This comparison point can help you drive creative decisions, as you may want to reduce – or increase – the use of a specific creative tag to align yourself with the competition.
See how you can use Creative Market Insights
Here is a concrete example.
The video tag “Danger Type” by Replai categorizes videos by the nature of the danger featured in creatives. Fire, bombs, fall, rocks – any element suggesting danger is automatically tagged on each creatives.
When filtering the tag gallery by your closest competitors, you can identify that you haven’t tried “Spikes” as a danger type in your videos, while this danger type is featured in 12% of your competitors’ creatives. This new insight can inform your creative ideation process – as a next step you may want to launch an ad with “Spikes” as a danger element.
Our competitive intelligence dashboard features:
- Ad libraries sorted by apps and publishers
- Automated video ad deconstruction (timeline)
- Competitors’ video tagging
- Tag usage comparison


